Project information
- Category: GIS Development
- Skills Used: Python, ArcGIS REST API, Streamlit
- Source Code: GitHub: Energy-Dashboard
- View it Live: Energy Dashboard for North America
Summary:
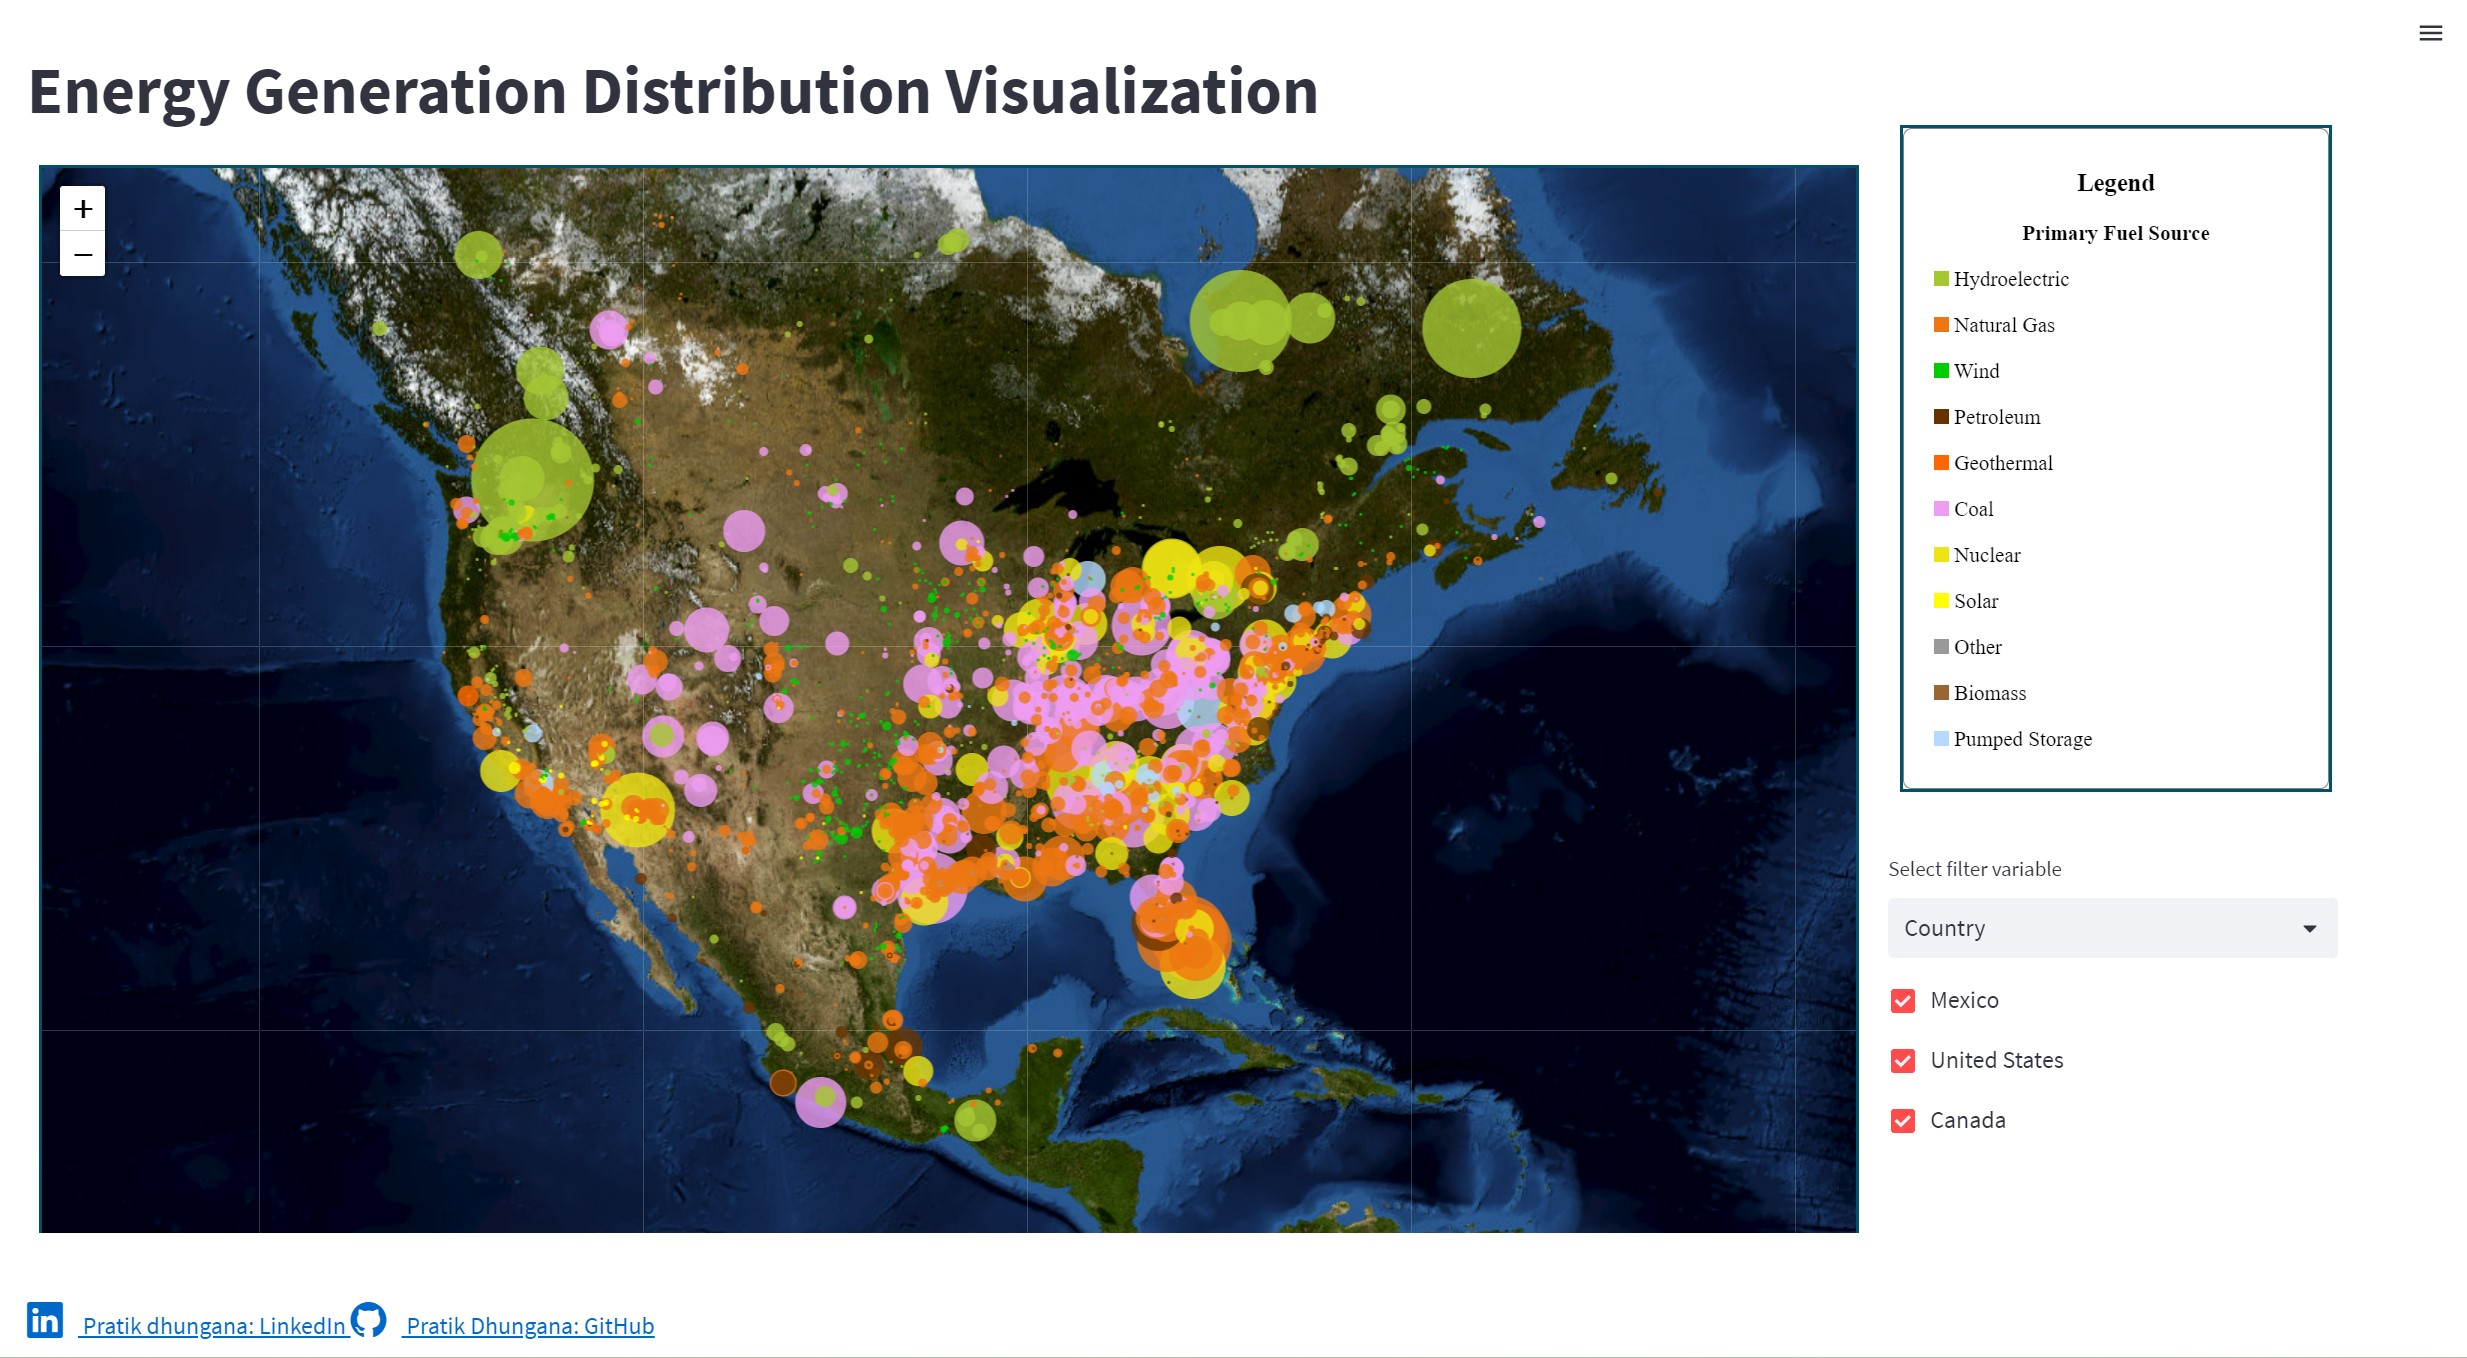
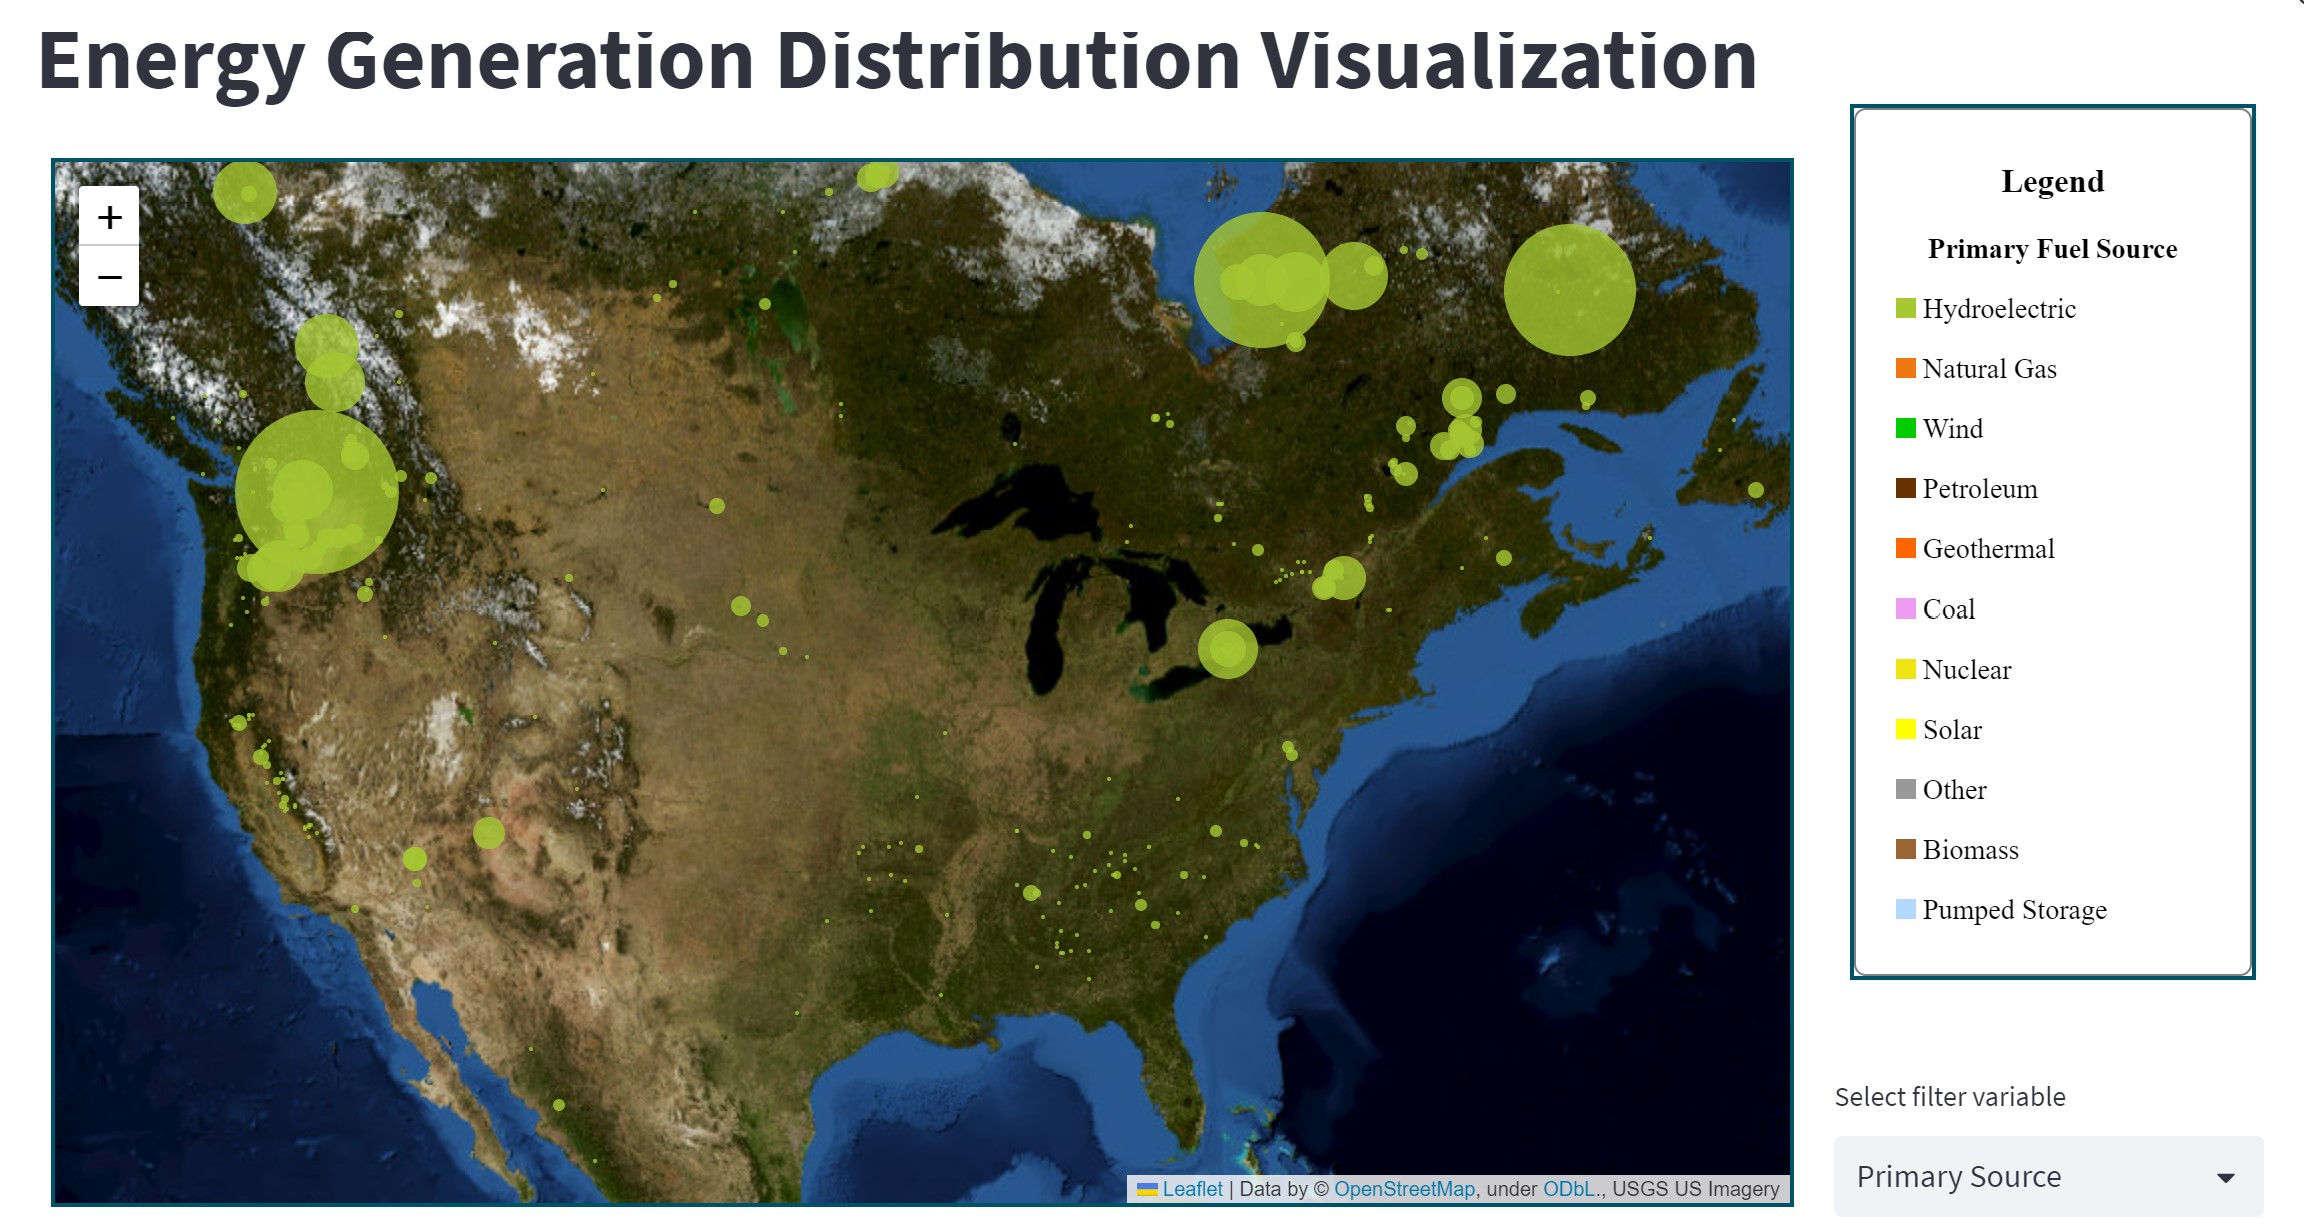
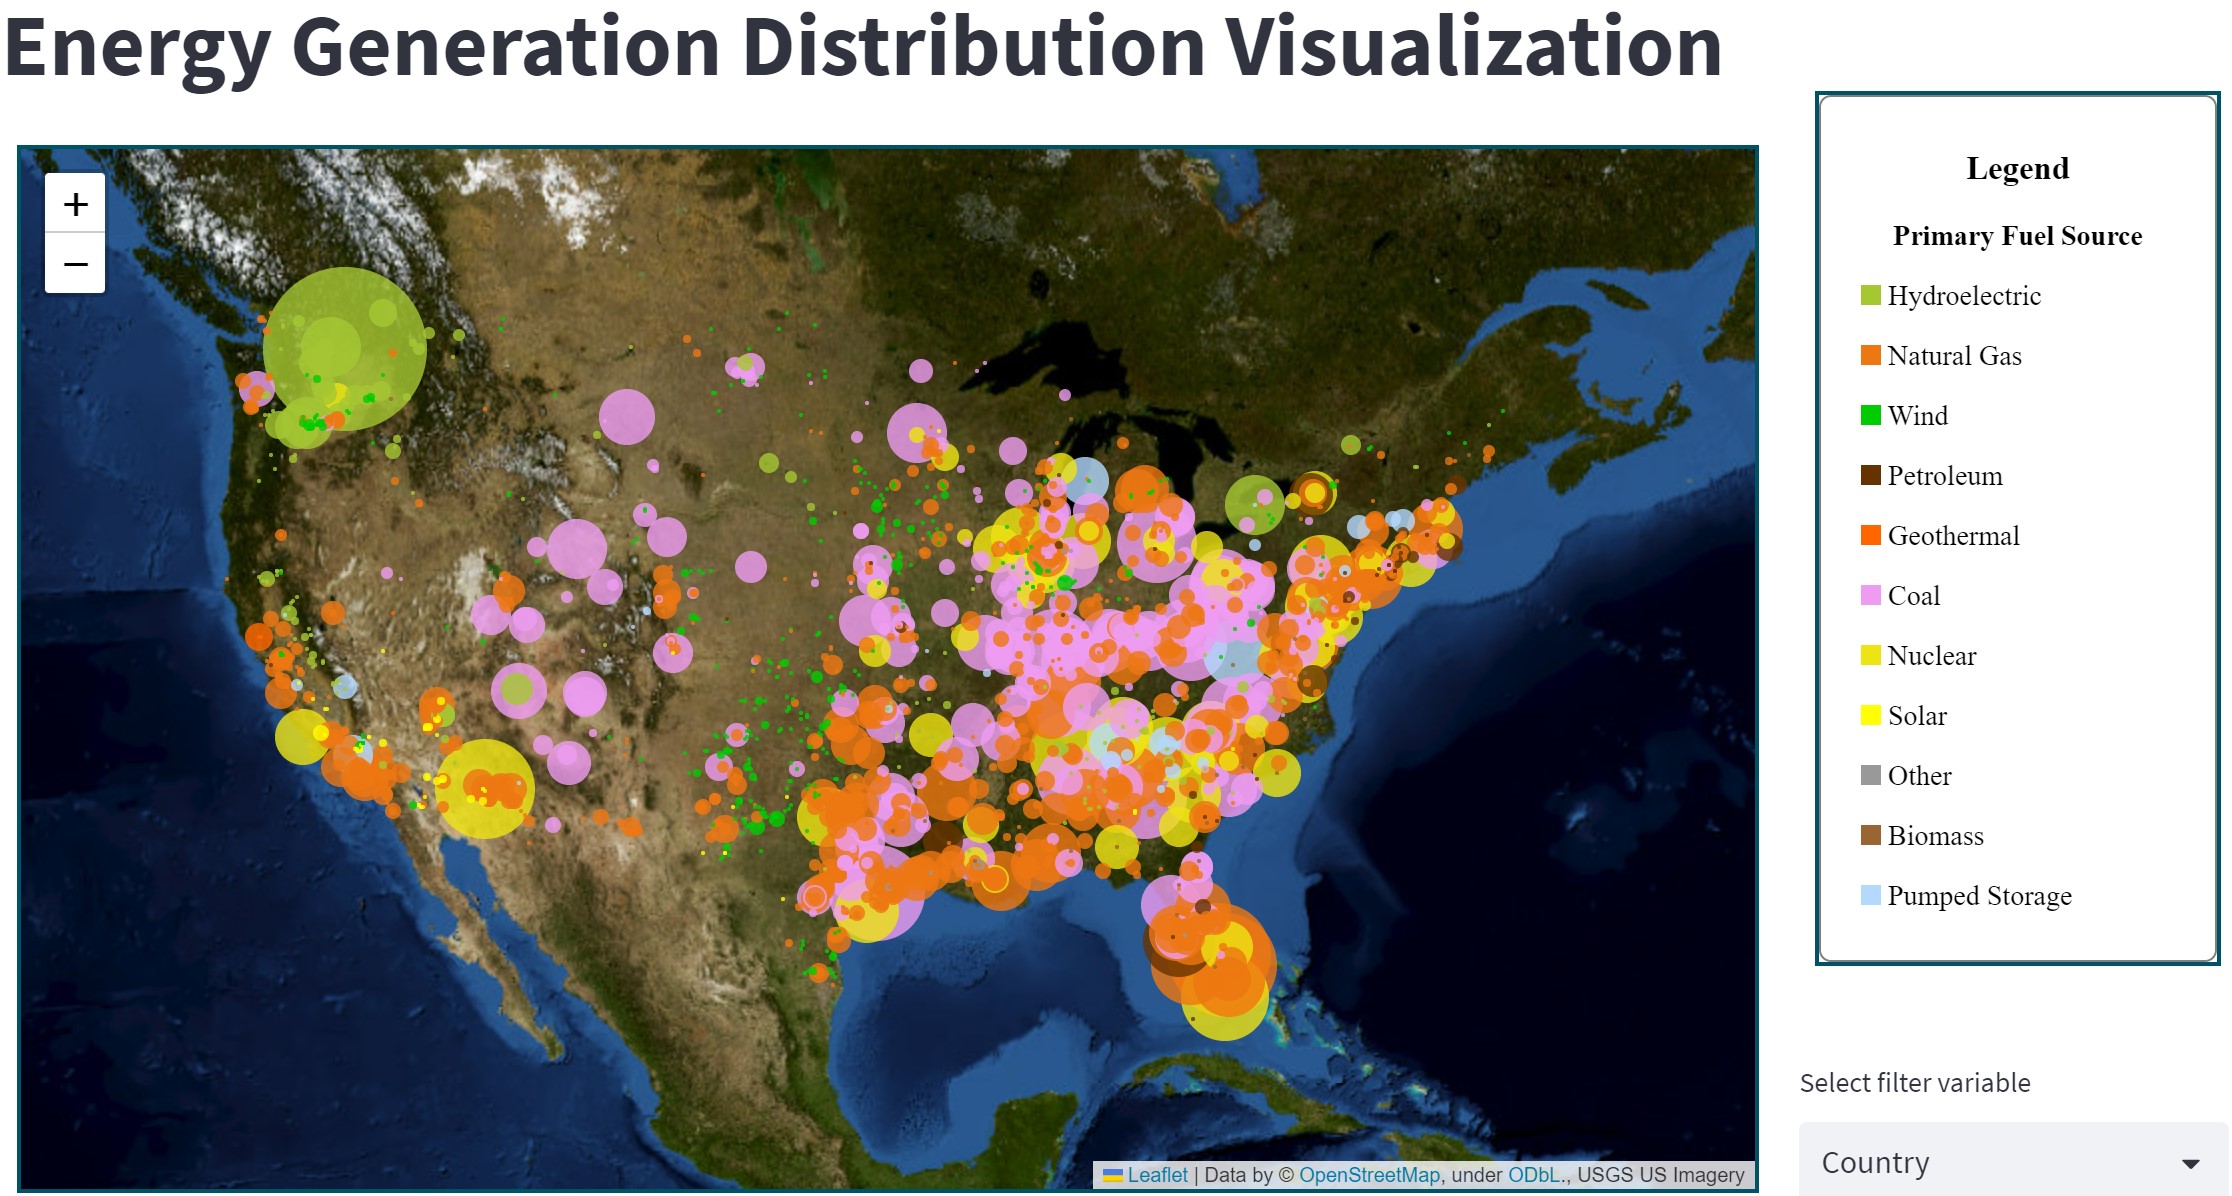
This is an interactive web application created using streamlit, which lets a user filter data based on country, fuel type and renewable fuel type.
This was created using the following steps:
- From ArcGIS REST API, data was queried to obtain Power Plants, 100 MW or more data in geojson format using requests library.
- Data was read as geodataframe using geopandas.
- A folium basemap was created with USGS US Imagery tiles.
- A streamlit application with a dropdown for selecting filter variables, checkboxes to filter data based on the filter variables was created.
- The filtering was applied using geopandas and each point after filtering was added to the map as circle marker with appropriate color, size and popup. This filtering is updated each time the filter variable or checkboxes change.
The map can be accessed at Energy Dashboard for North America


